This post is based on content from Your First Date with Data by Baraa Khatib Salkini
Introduction
Namaste!
Let me share a quick story: every time I jump into a new project, I roll up my sleeves and start solving problems right away. But in my early days, I’d skip straight to heavy analysis—querying tables I didn’t fully understand, or building models with data I hadn’t really looked at. The result? Confusing errors, weird outliers, and sometimes flat-out wrong conclusions. Eventually, I realized the importance of slowing down and giving the data a proper “hello.” In other words: Exploratory Data Analysis (EDA).
What Is EDA?
Think of Exploratory Data Analysis (EDA) like stepping off the plane in a city you’ve never visited. You roam the streets to see how everything connects: Which neighborhoods are close to each other? Where’s the best local coffee? Which spots are a bit sketchy at night? Without that initial exploring, you’d be lost, right?
In data terms, EDA is about:
Taking a good look at the dataset’s structure (columns, data types, weird outliers)
Getting a feel for its “personality”—what’s normal, what’s surprising, and where you might dig deeper later
It’s tempting to skip this and jump into building dashboards or training machine learning models. But I’ve learned the hard way that skipping this step often leads to confusion—or at least a few “Oh no, I didn’t know it worked that way!” moments.
How I See Data—My Secret Sauce
Over the years, I’ve discovered a simple mental shortcut for making sense of any dataset: think of each column as either a Dimension or a Measure.
Dimensions are descriptive fields you can group or filter by (like Country, Category, or Gender).
Measures are numeric fields that actually make sense to add up or average (like SalesAmount or Quantity).

Why is this so powerful? Once you identify what’s a Dimension and what’s a Measure, you can ask questions like, “How much of X did we have for each Y?” For example, “Total Sales (a Measure) by Country (a Dimension)” or “Average Price by Product Category.” It’s a quick way to generate insights without getting lost in a sea of columns.
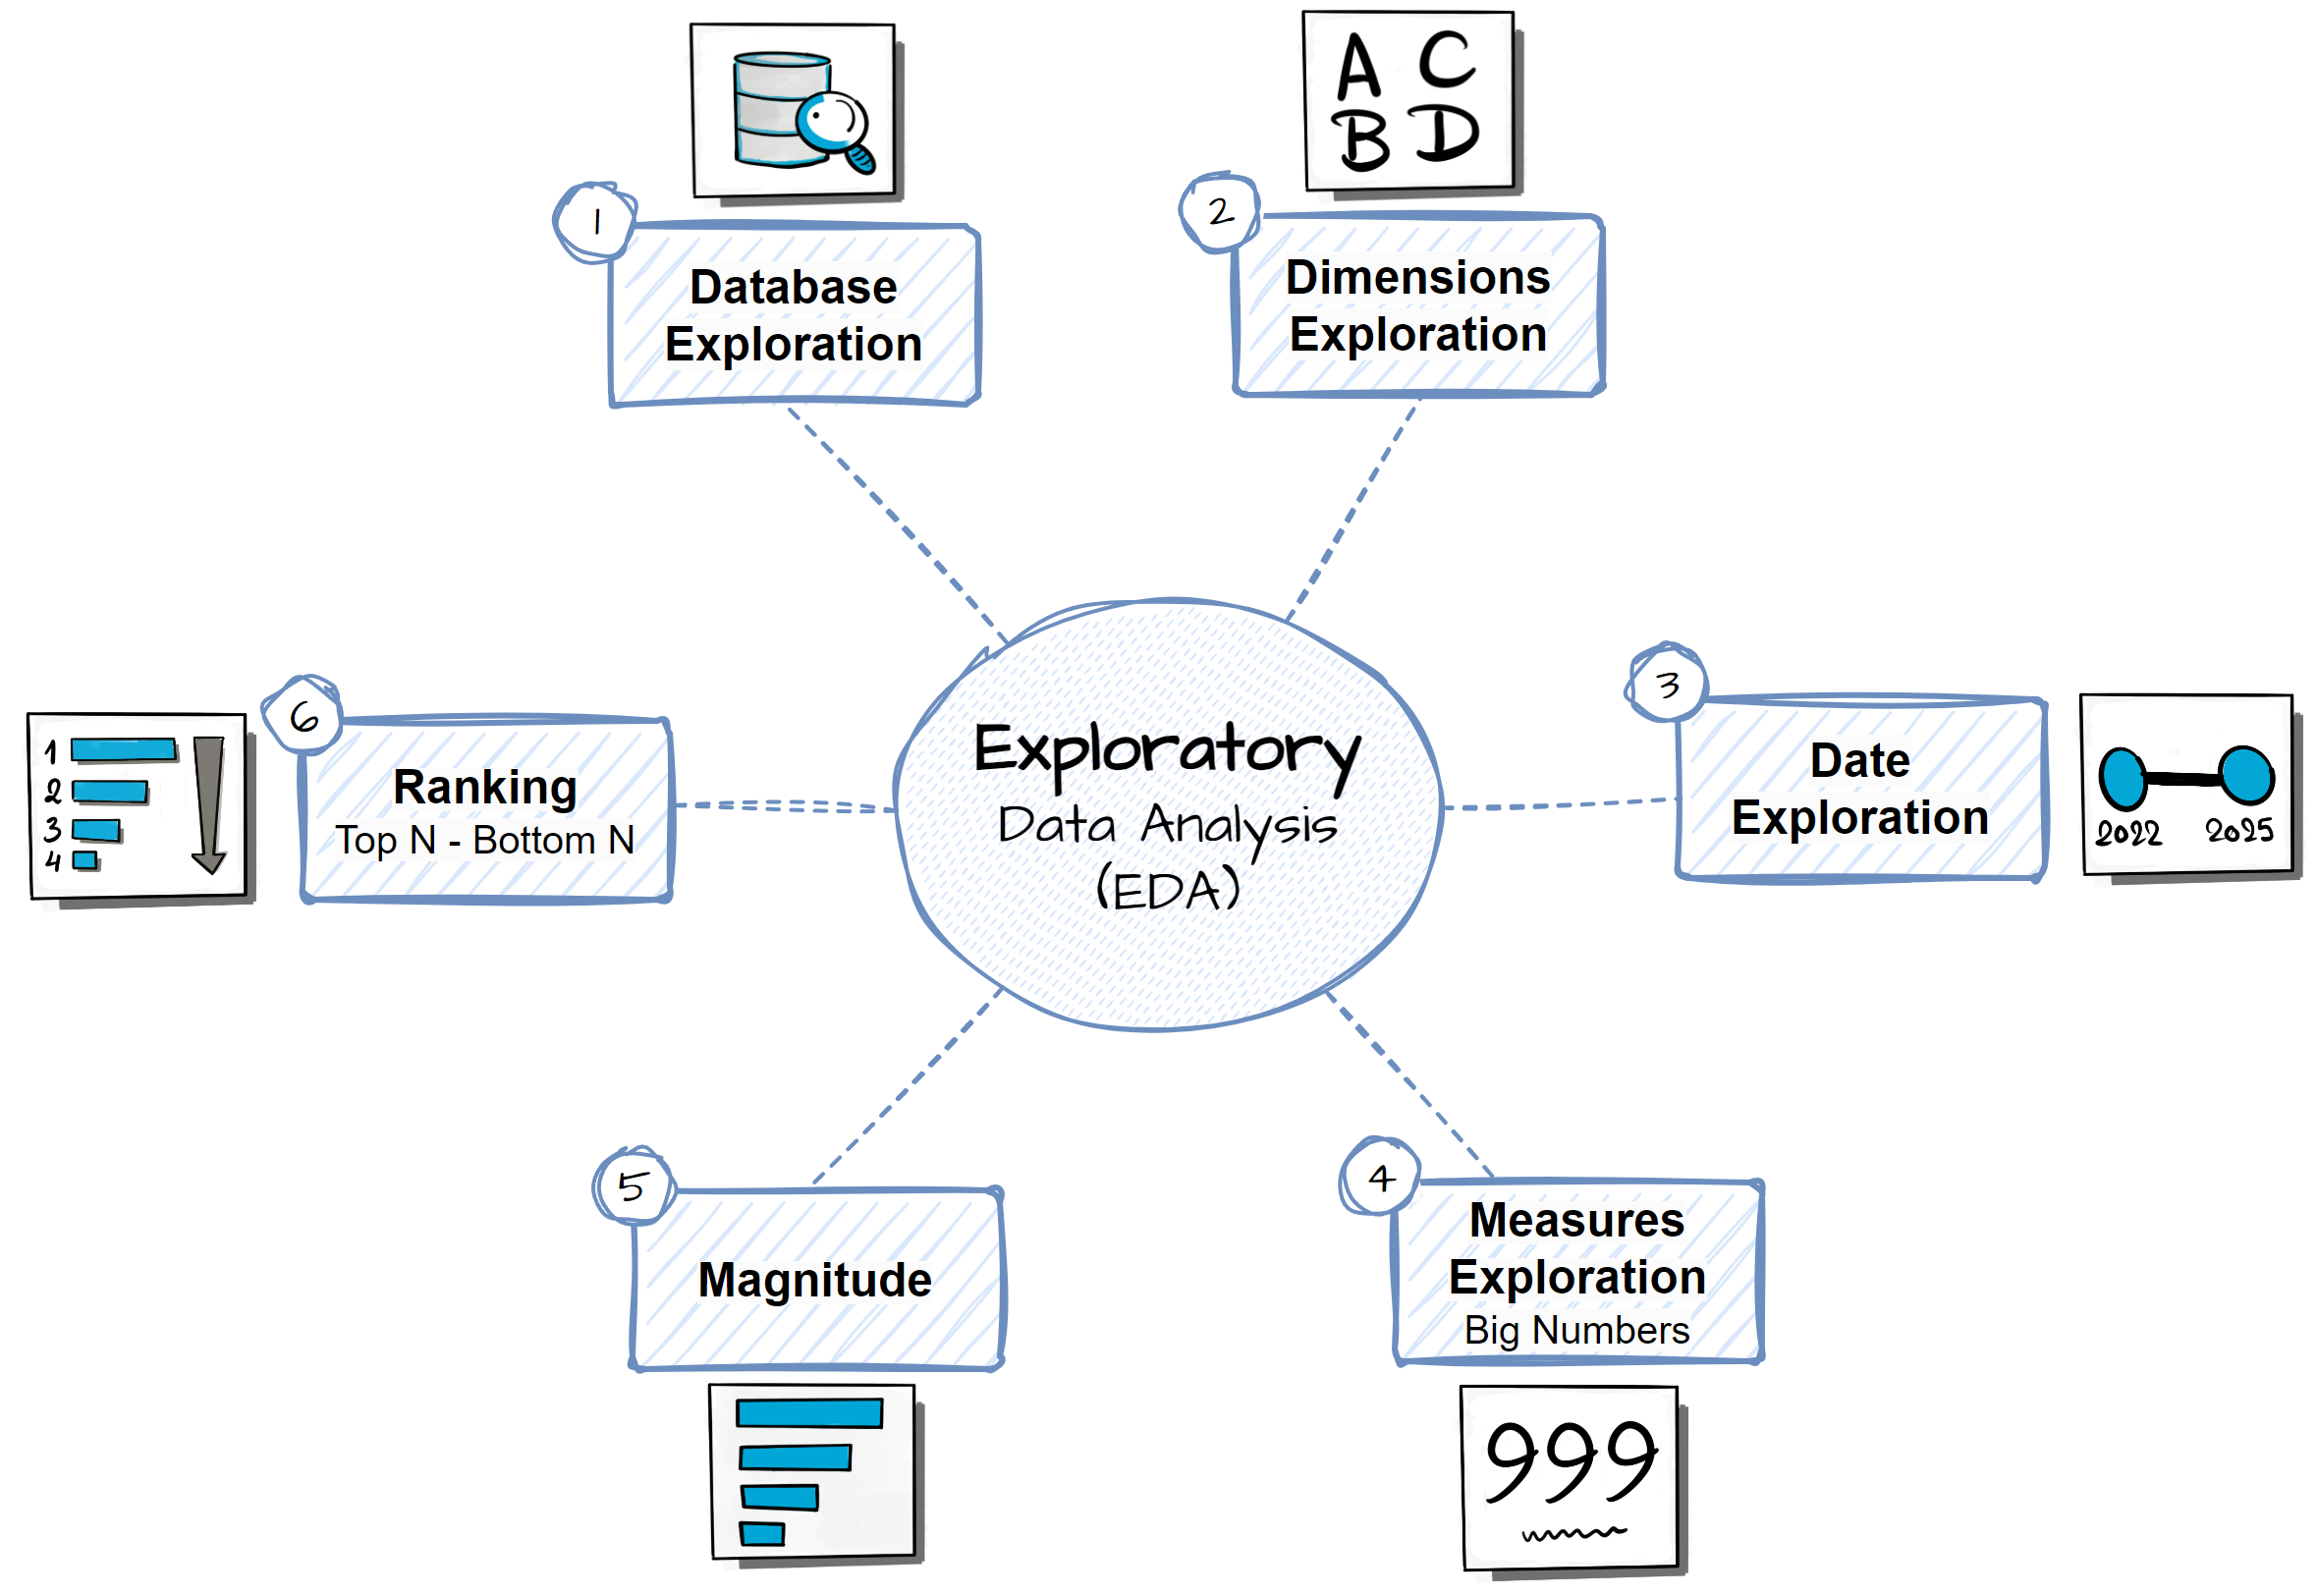
The Core EDA Steps

Now that you know the secret of Dimensions and Measures, how do you actually explore your dataset? Here’s the quick-start roadmap I follow every time:
1. Explore the Database
What it is: A quick scan to see how many tables exist, what columns they have, and whether those columns are Dimensions or Measures.
Example Questions:
“How many tables am I working with?”
“Which columns are numeric and which are text or date-based?”
2. Explore Dimensions
What it is: Checking distinct values in fields like Country, Category, or ProductName to identify all possible groups.
Example Questions:
“How many distinct countries do we have?”
“Which product categories show up in the Product table?”
3. Explore Dates
What it is: Finding the time range of your data—look for the earliest and latest dates to see if you’re dealing with months, years, or decades of data.
Example Questions:
“What is the earliest order date in our Sales table?”
“Is the data spanning one year or five years?”
4. Explore Measures
What it is: Calculating big-picture metrics like sums, averages, or counts—these give you an overall snapshot.
Example Questions:
“What’s the total revenue?”
“How many unique customers do we have?”
5. Magnitude Analysis
What it is: Using the formula [Measure] BY [Dimension] to see which categories or groups drive the biggest numbers.
Example Questions:
“What’s the total sales by product category?”
“Which country accounts for most of the orders?”
6. Ranking Analysis
What it is: Identifying the top or bottom performers in any measure. Perfect for spotting best-sellers or underperformers.
Example Questions:
“Which are the top 5 products by sales?”
“Which categories have the fewest total orders?”
Use these steps as your framework whenever you encounter a new dataset. Start broad, narrow down with questions, and keep digging deeper until you’ve uncovered all the stories your data has to tell!